i.Cee Dashboard: preventive maintenance that you can touch … LIVE and in colour
Richard Habering | 21. May 2021
Very often, the utility of preventive measures such as forward-looking risk minimisation and preventive maintenance is not easy to see without a specific example case. Such cases are normally provided with theoretical insights or alternative use cases. To make it clear for smart plastics, we have spared no expense in preparing a real-life test case.
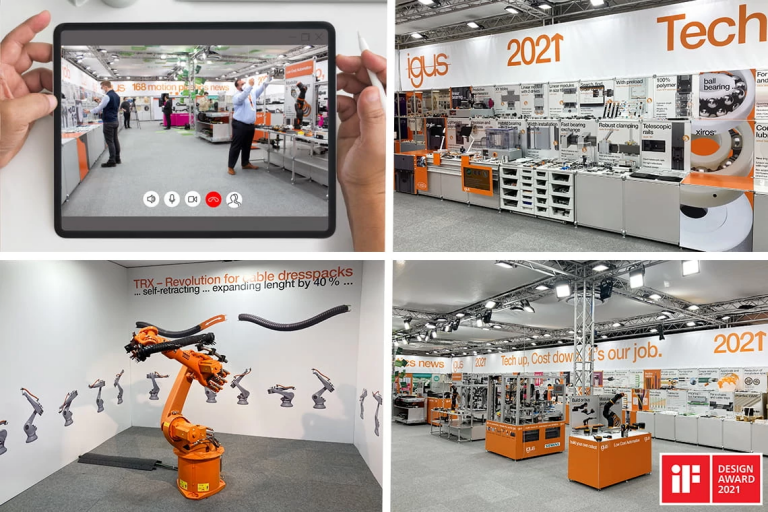
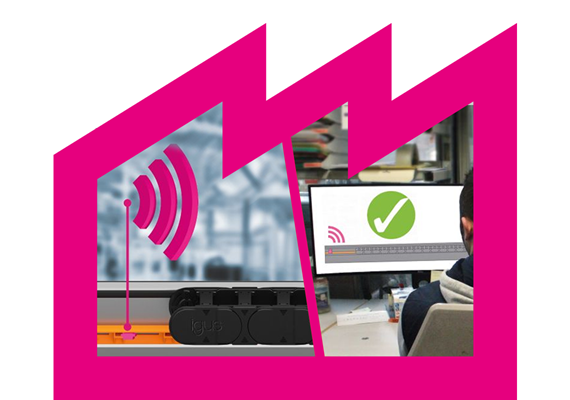
In our virtual/real trade show in Cologne, we have set up two test machines equipped with a complete i.Cee package of smart plastics for preventive maintenance. One machine is from the linear technology area. We dealt with it extensively in the last article. The other was for intelligent energy supply. Details of what is special about igus energy supply systems can be found here. In this article, we will focus on what is intelligent about this machine.
Preventive maintenance with intelligent plastics
Predictive maintenance uses sensors, software, and other elements of condition monitoring to create a system that allows dynamic service life calculation and determines the best times for maintenance. This makes predictive maintenance the next step towards implementing a comprehensive smart energy supply system concept. At igus, this concept is called i.Cee (derived from “I see ahead”) and is available in a wide variety of designs, offering a high degree of individuality. The goal is always to maximise system and user safety and product service life.
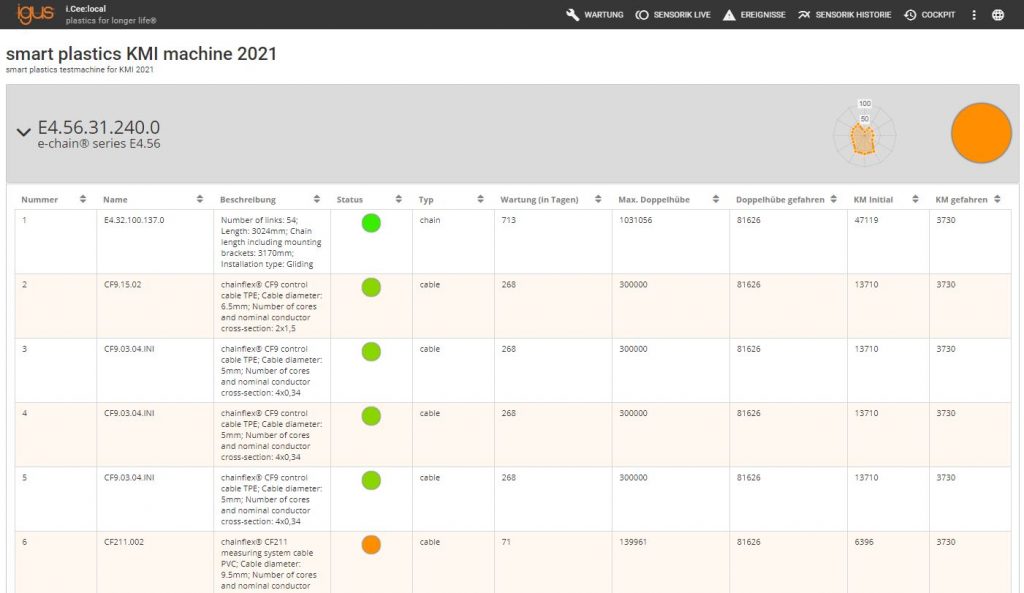
And B. the rest of the product service life is one of the primary elements of the i.Cee dashboard. At a glance, the dashboard shows the remaining service life of components equipped with smart technology. The output is in cycles or double strokes and days based on the travel speed or motion profile thus far. You can read here about the details of the input channels through which the motion profile can be fed. The current smart energy supply status is represented visually with the stoplight system. This gives the system operator a clear picture of the plant status at a glance, and he can plan the next preventive maintenance intervals.
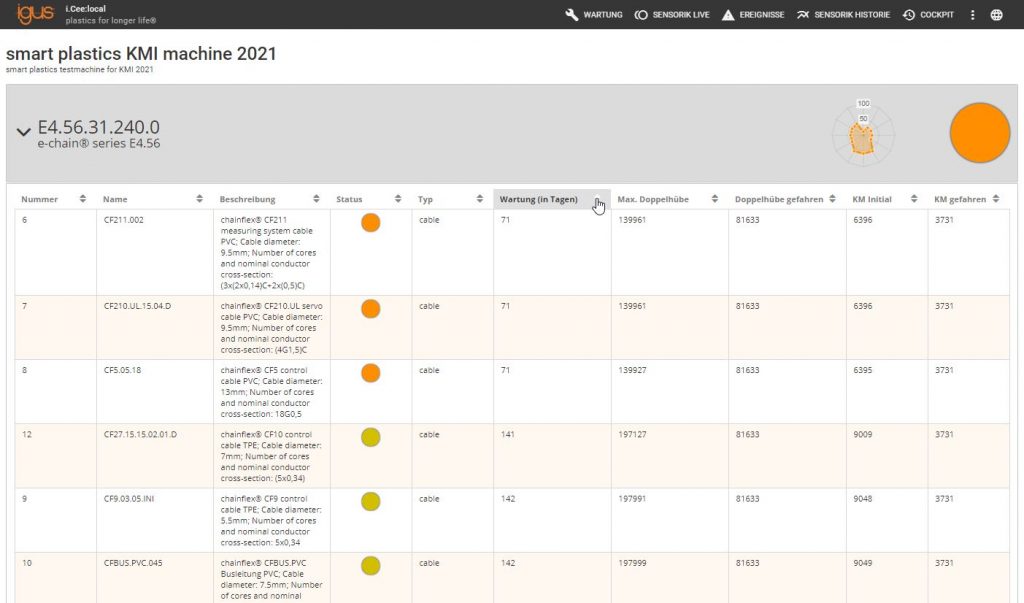
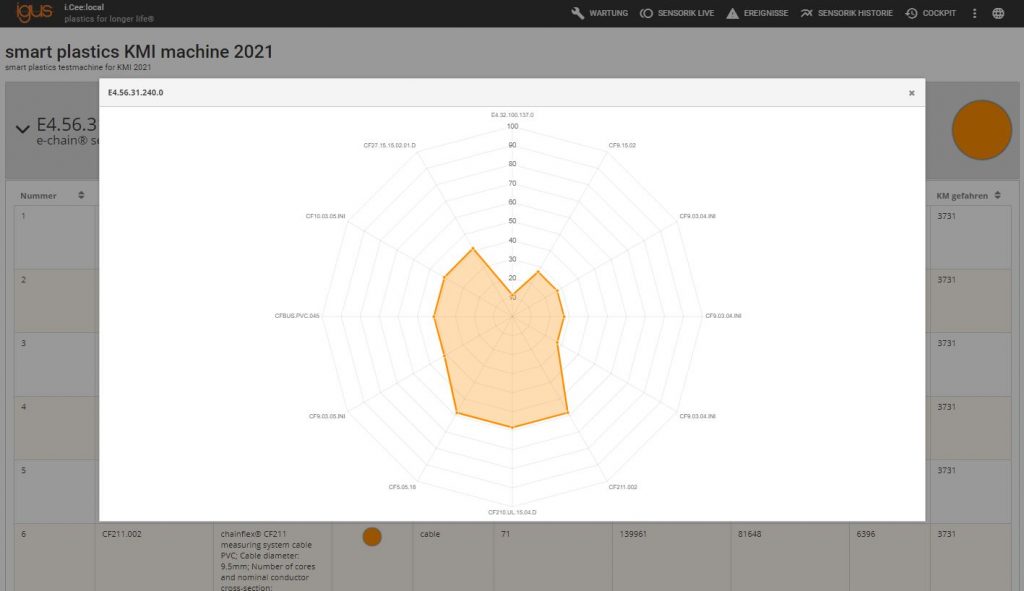
This overview also offers the useful function of sorting all components according to a specific criterion in individual column headings. For instance, they can be sorted in ascending order according to maintenance interval in days. This makes it easy for maintenance personnel to determine which component should be maintained during the next planned downtime. The information on the i.Cee dashboard can also be used for smart maintenance control and planning in advance. A spider graph can also be displayed, showing the user the condition of all components at a glance.
Local or in the cloud? The user retains data sovereignty
In our test example, the dashboard and data can be viewed directly in the internet (in the cloud) by any interested party. This internet-based solution has two options. In the first, sensors transfer your data directly to the cloud, where it is made available in a protected area that can be accessed with a browser dashboard. With the second option, the data takes an intermediate stop at the i.Cee.net, a so-called data concentrator. The i.Cee.net is at your location, allowing you to stop or adjust data exchange with the cloud at any time.
Each user can decide based entirely on his individual requirements. In the local variant, your data never leave your company network, since the i.Cee software communicates only within networks of your choice. The options range from an energy chain within a single machine to an entire machine park with its own output interface. All solution options have in common the goal of optimally providing the user all information necessary from preventive maintenance, greatly facilitating daily work.